
- 1M
- 3M
- 6M
- 1YR
- 3YR
- 5YR
- 10YR
- Since Inception
Performance
Monthly SIP of ₹ for
Below table shows comparison of Bandhan Banking & PSU Debt Fund with respect to the investments in Fixed Deposit and Gold for the
Total investment of
₹36,000 over the period of 3 years.
| Total Value | Gain | Return % | |
|---|---|---|---|
| This Fund | 39,881 |
3,881 |
6.77% |
| Bank FD | 39,824 |
3,824 |
6.5% |
| Gold | 40,770 |
4,770 |
8.00% |
Fund Information
-
As of 30 Apr 2026, fund size of Bandhan Banking & PSU Debt Fund is
12,051.35 Cr. -
Bandhan Banking & PSU Debt Fund shown here is of
Growthplan.
-
The Total Expense Ratio (TER) of the fund is
0.65%. The Total Expense Ratio (TER) is a measure that represents the total costs associated with managing and operating a mutual fund as a percentage of its average Assets under Management (AUM). It provides an insight into the overall expenses they will incur by investing in the fund.
-
Bandhan Banking & PSU Debt Fund is an
Debtoriented mutual fund in the
- Banking & PSU Fundcategory.
-
Nifty 50 Arbitrage Index
is the benchmark for Bandhan Banking & PSU Debt Fund. A benchmark for a mutual fund serves as a standard for performance comparison, helping investors assess how well the fund is meeting its objectives and how it fares against relevant market indicators. Investors often compare the fund's performance with the benchmark as well as its peers.
-
The inception date of a mutual fund refers to the date when the fund was first established and began operations. It is the starting point from which the fund's performance, returns, and other key metrics are calculated. The fund was started on
07 Mar 2013as at present it is 13 years old fund.
-
Name of the AMC is
Bandhan Mutual Fund.
Click here to
know moreabout Bandhan Mutual Fund.
Fund Managed By
Fund managers make investment decisions, optimizing returns and managing risks for portfolios. Responsibilities include market analysis, performance monitoring. Bandhan Banking & PSU Debt Fund managed by following fund manager(s);


How does the
Return Comparison of the Bandhan Banking & PSU Debt Fund fare against peer funds in the Banking & PSU fund category?
Peer fund returns can vary based on the collaborative nature and specific strategies employed by fund managers of these funds listed in below table, often showcasing different risk-return profiles compared to strategy adopted by Bandhan Banking & PSU Debt Fund. Below table demonstrate the returns generated by some peer funds and compare tho this fund and average return generate by the Debt, Banking & PSU fund category these peer funds belongs to.
| Fund Name | 1 Week | 1 Month | 3 Months | 6 Months | 1 Year | 2 Years | 3 Years | 5 Years | 10 Years |
|---|---|---|---|---|---|---|---|---|---|
| Category Best | 0.17% | 0.94% | 1.97% | 3.55% | 7.80% | 8.04% | 7.40% | 7.36% | 7.16% |
| Category Average | 0.04% | 0.54% | 1.68% | 2.93% | 4.98% | 6.74% | 6.78% | 6.03% | 6.80% |
| Bandhan Banking & PSU Debt Fund | 0.02% | 0.51% | 1.96% | 3.45% | 5.22% | 6.92% | 6.86% | 5.95% | 6.95% |
| SBI Banking & PSU Fund | 0.03% | 0.66% | 1.85% | 2.93% | 4.64% | 6.80% | - | - | - |
| ITI Banking And PSU Debt Fund | -0.02% | 0.46% | 1.24% | 2.48% | 4.39% | 6.28% | - | - | - |
| Canara Robeco Banking And PSU Debt Fund | 0.02% | 0.52% | 1.77% | 2.90% | 4.60% | 6.33% | - | - | - |
| Franklin India Banking & PSU Debt Fund | 0.17% | 0.82% | 1.77% | 3.30% | 5.79% | 7.33% | 7.20% | 6.12% | 6.98% |
| Kotak Banking & PSU Fund | 0.07% | 0.58% | 1.93% | 3.13% | 5.14% | 7.12% | 7.12% | 6.25% | 7.16% |
Fund Portfolio Details
Portfolio details of a fund generally refer to a comprehensive breakdown of the investments held within a specific investment vehicle, such as a mutual fund or exchange-traded fund (ETF). Portfolio details of Bandhan Banking & PSU Debt Fund are shown below;
Equity 0.00%
Debt 97.07%
Others 2.93%
Top Holdings
| Name of the Instrument | Holding Percentage |
|---|---|
| HDFC BANK LIMITED SR US003 7.70 NCD 16MY28 FVRS1LAC | 4.09% |
| NUCLEAR POWER CORPORATION OF INDIA LIMITED SR XXXVIII 7.70 BD 20MR38 FVRS1LAC | 3.40% |
| HDFC BANK LIMITED SR V004 8.55 NCD 27MR29 FVRS10LAC | 2.36% |
| HDFC BANK LIMITED SR U005 9 NCD 29NV28 FVRS10LAC | 2.21% |
| NTPC LIMITED SR 69 7.32 BD 17JL29 FVRS10LAC LOAUPTO10OT19 | 1.73% |
| Others | 86.21% |
Allocation by Instruments
| Type of the Instrument | Holding Percentage |
|---|---|
| DEBENTURE | 10.74% |
| BOND | 20.41% |
| GOVERNMENT SECURITIES | 2.60% |
Portfolio Holdings shown is as of 30 Apr 2026
Riskometer
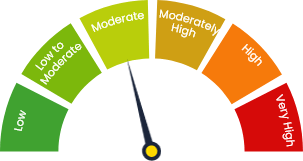
Investors understand that their
principal
will be at Moderate risk