
- 1M
- 3M
- 6M
- 1YR
- 3YR
- 5YR
- 10YR
- Since Inception
Performance
Monthly SIP of ₹ for
Below table shows comparison of Sundaram Ultra Short Duration Fund with respect to the investments in Fixed Deposit and Gold for the
Total investment of
₹36,000 over the period of 3 years.
| Total Value | Gain | Return % | |
|---|---|---|---|
| This Fund | 39,551 |
3,551 |
6.19% |
| Bank FD | 39,824 |
3,824 |
6.5% |
| Gold | 40,770 |
4,770 |
8.00% |
Fund Information
-
As of 31 Aug 2025, fund size of Sundaram Ultra Short Duration Fund is
2,014.73 Cr. -
Sundaram Ultra Short Duration Fund shown here is of
Growthplan.
-
The Total Expense Ratio (TER) of the fund is
1.43%. The Total Expense Ratio (TER) is a measure that represents the total costs associated with managing and operating a mutual fund as a percentage of its average Assets under Management (AUM). It provides an insight into the overall expenses they will incur by investing in the fund.
-
Sundaram Ultra Short Duration Fund is an
Debtoriented mutual fund in the
- Ultra Short Duration Fundcategory.
-
Nifty 50 Arbitrage Index
is the benchmark for Sundaram Ultra Short Duration Fund. A benchmark for a mutual fund serves as a standard for performance comparison, helping investors assess how well the fund is meeting its objectives and how it fares against relevant market indicators. Investors often compare the fund's performance with the benchmark as well as its peers.
-
The inception date of a mutual fund refers to the date when the fund was first established and began operations. It is the starting point from which the fund's performance, returns, and other key metrics are calculated. The fund was started on
05 Jan 2013as at present it is 13 years old fund.
-
Name of the AMC is
Sundaram Mutual Funds.
Click here to
know moreabout Sundaram Mutual Funds.
Fund Managed By
Fund managers make investment decisions, optimizing returns and managing risks for portfolios. Responsibilities include market analysis, performance monitoring. Sundaram Ultra Short Duration Fund managed by following fund manager(s);


How does the
Return Comparison of the Sundaram Ultra Short Duration Fund fare against peer funds in the Ultra Short Duration fund category?
Peer fund returns can vary based on the collaborative nature and specific strategies employed by fund managers of these funds listed in below table, often showcasing different risk-return profiles compared to strategy adopted by Sundaram Ultra Short Duration Fund. Below table demonstrate the returns generated by some peer funds and compare tho this fund and average return generate by the Debt, Ultra Short Duration fund category these peer funds belongs to.
| Fund Name | 1 Week | 1 Month | 3 Months | 6 Months | 1 Year | 2 Years | 3 Years | 5 Years | 10 Years |
|---|---|---|---|---|---|---|---|---|---|
| Category Best | 0.14% | 0.61% | 1.55% | 3.50% | 7.69% | 7.69% | 7.51% | 6.61% | 7.07% |
| Category Average | 0.11% | 0.53% | 1.41% | 2.91% | 5.95% | 6.97% | 6.87% | 5.62% | 6.16% |
| Sundaram Ultra Short Duration Fund | 0.09% | 0.45% | 1.18% | 2.73% | 6.14% | 6.27% | 6.21% | - | - |
| Aditya Birla Sun Life Savings Fund | 0.13% | 0.61% | 1.54% | 3.50% | 7.69% | 7.69% | 7.51% | 6.15% | 7.07% |
| Aditya Birla Sun Life Savings Fund | 0.13% | 0.61% | 1.54% | 3.50% | 7.69% | 7.69% | 7.51% | 6.15% | 7.07% |
| Mirae Asset Ultra Short Duration Fund | 0.12% | 0.57% | 1.51% | 3.37% | 7.39% | 7.49% | 7.36% | 5.91% | - |
| Baroda BNP Paribas Ultra Short Duration Fund | 0.11% | 0.54% | 1.45% | 3.28% | 7.20% | 7.32% | 7.30% | 5.96% | - |
| ICICI Prudential Ultra Short Term Fund | 0.13% | 0.57% | 1.51% | 3.38% | 7.28% | 7.35% | 7.21% | 5.94% | 6.92% |
Fund Portfolio Details
Portfolio details of a fund generally refer to a comprehensive breakdown of the investments held within a specific investment vehicle, such as a mutual fund or exchange-traded fund (ETF). Portfolio details of Sundaram Ultra Short Duration Fund are shown below;
Equity 0.00%
Debt 95.52%
Others 3.70%
Top Holdings
| Name of the Instrument | Holding Percentage |
|---|---|
| RURAL ELECTRIFICATION CORPORATION LIMITED SR 218 A 7.56 BD 30JU26 FVRS1LAC | 3.66% |
| NATIONAL BANK FOR AGRICULTURE AND RURAL DEVELOPMENT SR 23H 7.58 LOA 31JL26 FVRS1LAC | 3.44% |
| SMALL INDUSTRIES DEVELOPMENT BANK OF INDIA SR III 7.55 BD 22SP26 FVRS1LAC | 1.15% |
| HDB FINANCIAL SERVICES LIMITED SR A 1 FX 183 7.65 NCD 10SP27 FVRS10LAC | 1.15% |
| CHOLAMANDALAM INVESTMENT AND FIN. CO. LTD 8.45 NCD 21NV25 FVRS10LAC | 0.91% |
| Others | 89.69% |
Allocation by Instruments
| Type of the Instrument | Holding Percentage |
|---|---|
| BOND | 8.71% |
| DEBENTURE | 3.49% |
| GOVERNMENT SECURITIES | 0.69% |
Portfolio Holdings shown is as of 31 Aug 2025
Riskometer
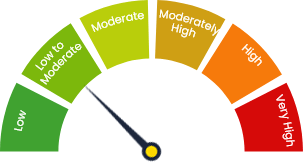
Investors understand that their
principal
will be at Low to Moderate risk