
- 1M
- 3M
- 6M
- 1YR
- 3YR
- 5YR
- 10YR
- Since Inception
Performance
Monthly SIP of ₹ for
Below table shows comparison of Nippon India Value Fund with respect to the investments in Fixed Deposit and Gold for the
Total investment of
₹36,000 over the period of 3 years.
| Total Value | Gain | Return % | |
|---|---|---|---|
| This Fund | 40,241 |
4,241 |
7.37% |
| Bank FD | 39,824 |
3,824 |
6.5% |
| Gold | 40,770 |
4,770 |
8.00% |
Fund Information
-
As of 30 Apr 2026, fund size of Nippon India Value Fund is
8,819 Cr. -
Nippon India Value Fund shown here is of
Growthplan.
-
The Total Expense Ratio (TER) of the fund is
1.77%. The Total Expense Ratio (TER) is a measure that represents the total costs associated with managing and operating a mutual fund as a percentage of its average Assets under Management (AUM). It provides an insight into the overall expenses they will incur by investing in the fund.
-
Nippon India Value Fund is an
Equityoriented mutual fund in the
- Value Fundcategory.
-
NIFTY 500 TRI
is the benchmark for Nippon India Value Fund. A benchmark for a mutual fund serves as a standard for performance comparison, helping investors assess how well the fund is meeting its objectives and how it fares against relevant market indicators. Investors often compare the fund's performance with the benchmark as well as its peers.
-
The inception date of a mutual fund refers to the date when the fund was first established and began operations. It is the starting point from which the fund's performance, returns, and other key metrics are calculated. The fund was started on
01 Jun 2005as at present it is 21 years old fund.
-
Name of the AMC is
Nippon India Mutual Fund.
Click here to
know moreabout Nippon India Mutual Fund.
Fund Managed By
Fund managers make investment decisions, optimizing returns and managing risks for portfolios. Responsibilities include market analysis, performance monitoring. Nippon India Value Fund managed by following fund manager(s);


How does the
Return Comparison of the Nippon India Value Fund fare against peer funds in the Value fund category?
Peer fund returns can vary based on the collaborative nature and specific strategies employed by fund managers of these funds listed in below table, often showcasing different risk-return profiles compared to strategy adopted by Nippon India Value Fund. Below table demonstrate the returns generated by some peer funds and compare tho this fund and average return generate by the Equity, Value fund category these peer funds belongs to.
| Fund Name | 1 Month | 3 Months | 6 Months | 1 Year | 2 Years | 3 Years | 5 Years | 10 Years |
|---|---|---|---|---|---|---|---|---|
| Category Best | 9.63% | 13.78% | 21.30% | 37.06% | 14.83% | 25.37% | 16.36% | 15.49% |
| Category Average | 1.14% | 2.26% | 1.37% | 3.49% | 1.16% | 15.07% | 13.59% | 14.06% |
| Nippon India Value Fund | 0.93% | 1.04% | -1.90% | -0.93% | 0.73% | 16.32% | 14.85% | 15.31% |
| Motilal Oswal BSE Enhanced Value Index Fund | -3.12% | -3.69% | -4.35% | 6.55% | 1.07% | 25.37% | - | - |
| Quant Value Fund | 2.42% | 12.04% | 18.11% | 14.46% | 2.81% | 22.52% | - | - |
| HSBC Value Fund | 0.46% | 0.70% | 0.37% | 1.39% | 1.93% | 18.06% | - | - |
| Axis Value Fund | 2.29% | 4.30% | 2.88% | 5.48% | 4.57% | 17.74% | - | - |
| DSP Value Fund | 1.56% | 3.77% | 3.00% | 10.92% | 8.18% | 17.36% | 13.21% | - |
Fund Portfolio Details
Portfolio details of a fund generally refer to a comprehensive breakdown of the investments held within a specific investment vehicle, such as a mutual fund or exchange-traded fund (ETF). Portfolio details of Nippon India Value Fund are shown below;
Equity 99.48%
Debt 0.00%
Others 0.52%
Top Equity Holdings
| Name of the Equity | Holding Percentage |
|---|---|
| HDFC Bank Ltd | 7.48% |
| NTPC LTD. | 4.89% |
| STATE BANK OF INDIA | 4.81% |
| INDUSIND BANK LTD. | 3.69% |
| AXIS BANK LTD. | 3.32% |
| Others | 75.81% |
Allocation by Sector
| Name of the Sector | Holding Percentage |
|---|---|
| Financial Services | 37.30% |
| Financial | 32.21% |
| Consumer Durables | 10.33% |
| Energy | 9.11% |
| Capital Goods | 7.64% |
| Others | 3.41% |
Portfolio Holdings shown is as of 30 Apr 2026
Riskometer
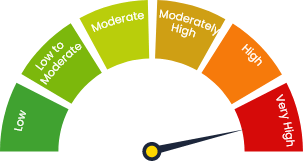
Investors understand that their
principal
will be at Very High risk