Fund Performance
Lumpsum
SIP
17.63
as on 16 Aug 20223 Years
Investment of ₹ 10,000 in this fund 3 Years back would be ₹ 16,282 today.
NAV Performance

Fund Information
-
₹ 541.068
as on 16 Aug 2022 -
Regular - Growth
-
-
-
₹ 5,000
-
₹ 2,749 Cr.
as on 31 Dec 2021 -
0.4%
-
01 Mar 2018
-
S&P BSE SENSEX TRI
-
HDFC Mutual Fund
Show All Funds -
HDFC Index Fund - Sensex Plan (Post Addendum) charges 0.25% of sell value; if fund sold before 3 days. There are no other charges.
Highlights of this fund
HDFC Index Fund - Sensex Plan is an Open-ended Equity Fund. The fund belongs to Index Funds/ETFs category, where the investment is done in predominantly in stocks that are listed on Stock Exchanges like the Bombay Stock Exchange (BSE) or the National Stock Exchange (NSE) in India as well as Global stock exchanges like the Dow Jones, London Stock Exchange or LSE etc. This fund was started on 01 Mar 2018. This fund is offered by one of the top AMC (Assets Management Company) HDFC Mutual Fund. You can also view here all other Equity funds offered by HDFC Mutual Fund.
Latest NAV of the fund is ₹ 541.068 as on 16 Aug 2022.
This fund has 4 years of track record. Since 31 Oct 2021 expense ratio of this fund is 0.4%. Ideally you shoulds compare this fund with the benchmark S&P BSE SENSEX TRI.
You can invest in this fund in SIP with the minimum investment of ₹ 500. Lumpsum invest is offered with minimum investment of ₹ 5,000.
Fund Objective
To generate returns that are commensurate with the performance of the SENSEX, subject to tracking errors.
List of Fund Managers of HDFC Index Fund - Sensex Plan
-
About Arun Agarwal
-
About Krishan Daga
Riskometer : Risk associated with this fund
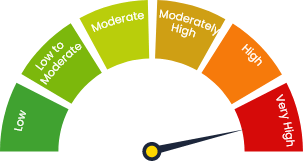
Investors understand that their principal will be at Moderately High Risk
Fund Return Comparison
Fund Name | 1 Month | 3 Months | 6 Months | 1 Year | 2 Years | 3 Years | 5 Years | 10 Years | 1 Year | 2 Years | 3 Years | 5 Years | 10 Years |
---|---|---|---|---|---|---|---|---|---|---|---|---|---|
Category Best | 13.30% | 16.99% | 9.01% | 32.56% | 38.05% | 20.97% | 14.21% | 15.33% | 14.62% | 24.21% | 25.48% | 16.33% | 14.02% |
Category Average | 10.67% | 12.63% | 3.89% | 9.38% | 27.63% | 17.87% | 12.45% | 13.27% | 9.41% | 17.66% | 20.78% | 15.54% | 13.29% |
HDFC Index Fund - Sensex Plan | 11.48%₹ 11,147 | 13.64%₹ 11,363 | 3.86%₹ 10,386 | 8.52%₹ 10,852 | 10.39%₹ 12,662 | 26.45%₹ 16,010 | 17.00%₹ 28,371 | 17.63%₹ 16,282 | 20.46%₹ 48,581 | 14.21%₹ 19,435 | 16.30%₹ 90,184 | 13.85%₹ 36,598 | 14.02%₹ 2,49,605 |
DSP Equal Nifty 50 Fund | 11.07%₹ 11,106 | 12.97%₹ 11,296 | 4.64%₹ 10,463 | 11.16%₹ 11,116 | 12.22%₹ 12,777 | 33.49%₹ 17,847 | 21.81%₹ 29,656 | 20.97%₹ 17,710 | 25.48%₹ 52,062 | - | - | - | - |
Principal Nifty 100 Equal Weight Fund | 10.18%₹ 11,018 | 12.44%₹ 11,243 | 3.61%₹ 10,360 | 8.63%₹ 10,862 | 8.75%₹ 12,559 | 28.90%₹ 16,639 | 18.53%₹ 28,779 | 19.56%₹ 17,098 | 22.24%₹ 49,796 | 10.34%₹ 16,356 | 15.17%₹ 87,714 | 11.83%₹ 30,599 | 11.89%₹ 2,22,830 |
UTI Nifty Next 50 Index Fund | 10.24%₹ 11,024 | 12.87%₹ 11,287 | 4.91%₹ 10,490 | 8.90%₹ 10,890 | 8.53%₹ 12,545 | 25.34%₹ 15,728 | 17.31%₹ 28,454 | 18.28%₹ 16,556 | 20.29%₹ 48,465 | - | - | - | - |
UTI Nifty Index Fund | 11.26%₹ 11,126 | 13.24%₹ 11,324 | 3.66%₹ 10,365 | 8.71%₹ 10,870 | 10.10%₹ 12,644 | 27.42%₹ 16,257 | 17.54%₹ 28,515 | 18.22%₹ 16,530 | 21.17%₹ 49,065 | 13.50%₹ 18,840 | 16.33%₹ 90,238 | 13.59%₹ 35,780 | 13.89%₹ 2,47,911 |
IDFC Nifty Fund | 11.23%₹ 11,122 | 13.28%₹ 11,327 | 3.78%₹ 10,377 | 8.67%₹ 10,866 | 10.23%₹ 12,652 | 27.06%₹ 16,164 | 17.31%₹ 28,455 | 18.21%₹ 16,524 | 21.00%₹ 48,948 | 13.47%₹ 18,815 | 16.25%₹ 90,075 | 13.69%₹ 36,090 | 13.88%₹ 2,47,741 |
Portfolio Holdings
Top Sector Holdings of HDFC Index Fund - Sensex Plan
Name of Sector | Holding Percentage | Holding Values in Crore |
---|---|---|
Banks | 27.57% | ₹ 803.15 Cr. |
Computers - Software | 20.19% | ₹ 588.36 Cr. |
Refineries/Marketing | 12.42% | ₹ 361.90 Cr. |
Housing Finance | 7.11% | ₹ 207.34 Cr. |
NBFC | 4.33% | ₹ 126.07 Cr. |
Others | 28.38% | - |
Top Stock Holdings of HDFC Index Fund - Sensex Plan
Name of Stocks | Holding Percentage | Holding Values in Crore |
---|---|---|
Reliance Industries Ltd. | 12.42% | ₹ 361.90 Cr. |
Infosys Ltd. | 10.51% | ₹ 306.46 Cr. |
HDFC Bank Ltd. | 9.85% | ₹ 287.09 Cr. |
ICICI Bank Ltd. | 7.81% | ₹ 227.68 Cr. |
Housing Development Finance Corporation Ltd. | 7.11% | ₹ 207.34 Cr. |
Others | 52.30% | - |
Other Holdings
Holding Type | Holding Percentage |
---|---|
TREPS | 0.14% |
Reverse Repo | 0.04% |
Net Receivables | -0.20% |